

Aucotec
Physics and logic combined
Traditionally, the physical connections and the control and safety-related logic of devices are mapped separately. But why redraw functions neutrally when the Piping & Instrumentation Diagram already contains so much basic data?

The control of a system is highly complex. It is based on the data for a number of devices whose functions such as cooling, pumping, opening and much more enable the desired processes. However, in order for the devices to perform their tasks properly, the automation engineers must be able to understand all the connections, requirements and rules. This is the only way they can provide the control system programmers with correct specifications. In addition to targeted operation, system safety is also essential. Numerous mechanisms must be implemented to shut down entire systems or parts of them in a controlled manner in the event of maintenance or an emergency. But what is the most efficient way to obtain such vital data?

From P&ID to SCD: Physical connections from various P&IDs with all logical relationships combined in one graphic.
© AucotecTraditionally, all devices and their physical connections are planned and mapped in the P&IDs (Piping & Instrumentation Diagrams) of the process specialists. Automation professionals use FBDs (Function Block Diagrams) to define the control and safety-relevant logic and signal paths for control system programming. But why redraw functions neutrally when the P&ID already contains so much basic data? With their graphical system overview, P&IDs are virtually the birthplace of automation, but they only show the interaction of the systems in a simplified form. An FBD, on the other hand, neutrally represents the processing of only a few signals from and to I/Os. Their relationship to the whole is not readily apparent.
Scandinavia shows the way

With this in mind, experts from the Scandinavian offshore oil and gas industry developed and established the SCD (System Control Diagram) many years ago in their Norwegian standard Norsok. This type of diagram can complement FBDs very helpfully, and in some cases even replace them. It is effectively a P&ID broken down to all control-relevant elements with a focus on automation. From the sensor to the actuator, an SCD graphically displays all reciprocal controls and interlocks in a clear and uniform manner. The focus creates space and allows several P&ID extracts to be combined in one SCD in a comprehensible way.
There are a few similar approaches outside the Scandinavian region, but they are not subject to any official standard and are nowhere near as widespread and integrated as the SCDs in Northern Europe. However, the advantages of merging physical and logical relationships are obvious: "We can no longer imagine life without SCDs. As an elementary tool for automation development in the dialog between automation, process and safety engineers, it serves as a reliable source for understanding the control of the plant right through to plant operation," says Idar Pe Ingebrigtsen, Principle Engineer at Equinor and head of a project at the IEC that is due to start shortly, which is intended to elevate the previous IEC standard PAS 63131 to IEC 63131 for the SCD definition.
Once for all(s)

An SCD section: The connection from the tank to the control valve, including the safety-relevant shutdown function.
© AucotecGerman software developer Aucotec became aware of this format through customers such as Equinor, Kongsberg and Haldor Topsoe, all from Scandinavia and active in the oil and gas sector, and has incorporated it into its data-centric platform Engineering Base (EB). "Not only are SCDs particularly easy to create in EB, they also don't require the usual data transfers and reconciliations with other systems, which makes change management much easier," says Dr. Pouria Bigvand, Senior Product Manager at Aucotec. Until now, SCDs were separate documents with no reference to the overall system. EB is different.
There, each object exists only once. All core engineering disciplines access a common data model. The various specialists gradually add more and more details to objects and functions. Everyone involved can always see the current status of the digital twin of the (sub)plant. Changes in one discipline are immediately visible in all others. The respective discipline-specific views of the planning contain their own representations, but are fed from the same objects. This not only optimizes change management, but also ensures that no change is forgotten. The resulting data quality is an important pillar in the entire project lifecycle.
Benefits for all
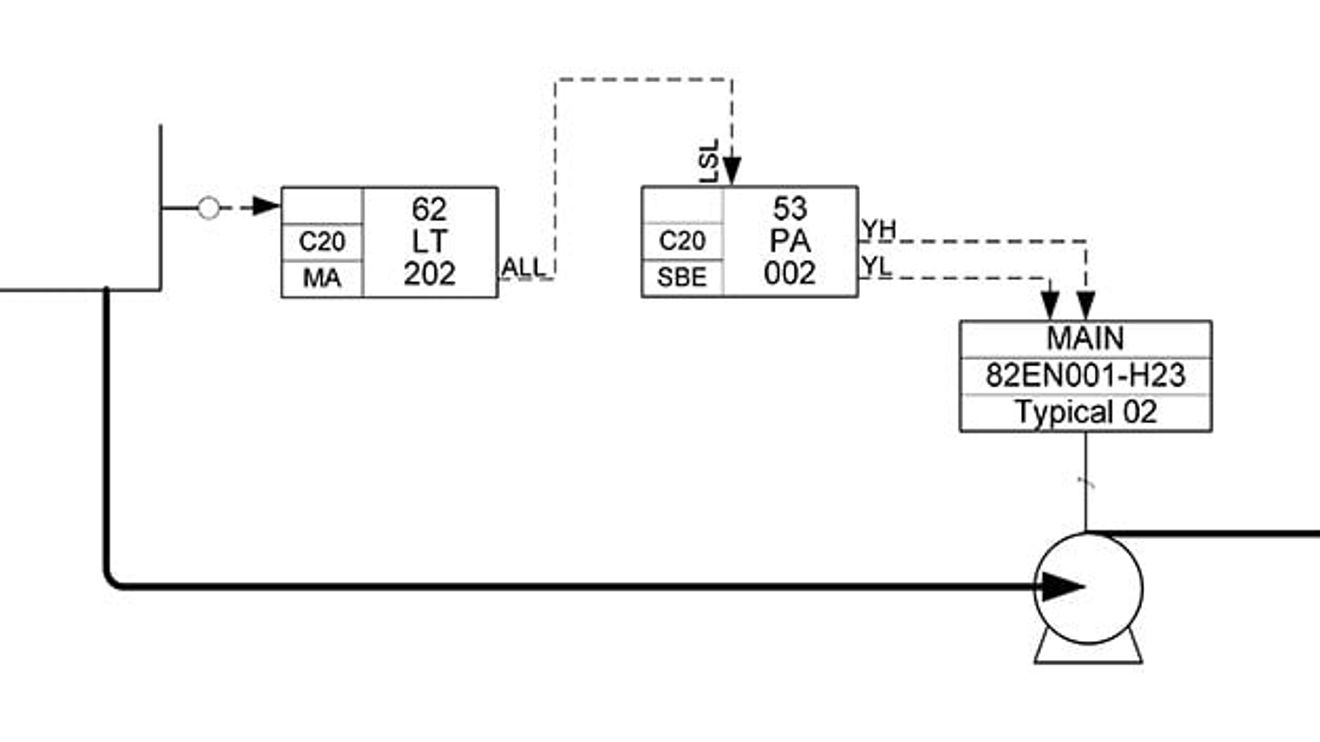
An SCD cut-out: The connection between the level sensor and pump, including safety interlock.
© AucotecFor these reasons, Bigvand is convinced that SCDs offer advantages to every plant manufacturer and operator. EB's data model makes it possible to create a comprehensive control logic graphic for each P&ID in an SCD in order to really clarify all system interrelationships. EB transfers the programming specifications directly from the SCD to the control system manufacturers. Subsequent P&ID changes are automatically visible in the SCD, and the specifications or changes to the control system programming are also available in EB - thanks to import via AML. These are all components that keep a digital twin up to date at all times. FBDs, on the other hand, are often no longer updated once a project has reached a certain status.
C&E tables automatically
Another advantage of EB's comprehensive knowledge of physical and logical connections is the ability to output cause & effect (C&E) tables at the touch of a button. They can be used to check the correctness of the system function definitions during the commissioning phase. They show, for example, whether a valve remains closed because it has been defined as such or because it is wired incorrectly.

Without EB, the P&IDs, FBDs or SCDs and other documents from the engineering disciplines involved, and therefore often from different sources, would have to be laboriously searched through and the data entered manually for these tables - depending on the system scenario. This ties up highly qualified experts for several weeks, with no guarantee of reliability. EB, on the other hand, retrieves the data for the C&E or safety matrices from the central model and can display them in an instant. As the model is always up to date, all data is 100 percent consistent. "No other engineering system can do that," says Product Manager Bigvand.


You might also be interested in
New high-performance CNC series
The 'FS500i-A' CNC controller from Fanuc, which was presented in the development phase as the 'FS 50i-A', offers 2.7 times higher CPU performance and, according to the manufacturer, enables faster cycle times, improved 5-axis simultaneous machining...
 read more...
Dual leadership in Shanghai
Stefan Becker has been appointed Managing Director of Eckelmann Automation Technology in Shanghai and will manage the subsidiary together with Zhongwei Huang.
read more...New composition of the Executive Board
The Management Board of the ifm group of companies presents itself in its new composition for the first time.
read more...Virtualized control systems using TSN backbone
The major challenges in implementing virtualized control systems are scalability and connectivity to the field level. An implementation at the ISW shows that this can already be achieved today using a TSN network.
read more...New Chief Financial Officer appointed
As of August 19, 2024, Christian Rothe is Senior Vice President and Chief Financial Officer at Rockwell Automation. He will report to Rockwell Chairman and Chief Executive Officer Blake Moret.
read more...New threat to industrial control systems
FrostyGoop is the name of a new malware variant that specializes in industrial control systems (ICS). It poses a threat to critical infrastructures worldwide. OT cyber security expert Dragos has identified FrostyGoop.
read more...Why waiting is not an option
If you want to remain competitive in automation and control technology, you should take the first steps towards AI. It is important to avoid dead ends, reduce task complexity and keep an eye on the issue of fleet observability.
read more...Revolution of the business model
Linux-based automation systems, including PLCs, industrial PCs and IoT devices, are currently leading to the consolidation and opening up of systems. However, opening up only on a device basis is only half the battle.
read more...Phoenix Contact at the Hannover Messe
Strategic technology partnership with Festo
Festo will use PLCnext Technology, the open ecosystem from Phoenix Contact, in future intelligent devices. In this way, both companies want to combine their innovative strength with the aim of taking industrial automation to a new level.
read more...